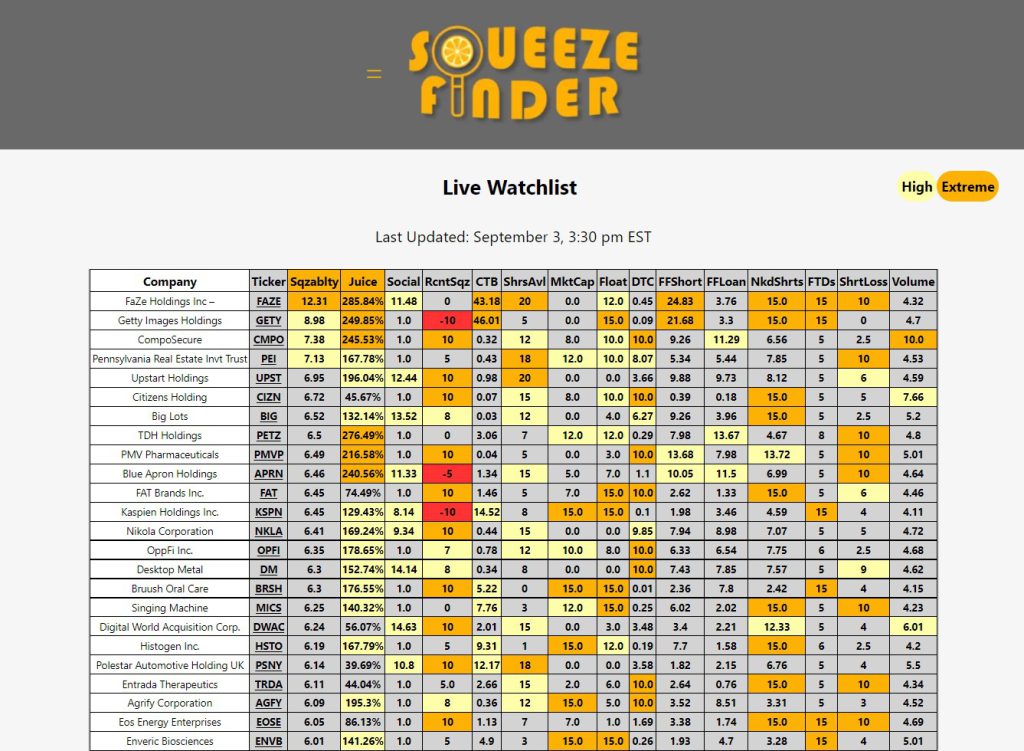
The SqueezeFinder Live Watchlist is updated every 30 minutes with a combination of short interest data from several sources, giving you the best and most current data available. All you have to do is check the Watchlist regularly and look for the most amount of orange squares on a single ticker.
Here’s a recent sample of the Live Watchlist:
Cost to Borrow (CTB) – The highest ranked criteria is the Cost to Borrow. This is the annual interest rate that short sellers must pay, accrued daily, in order to hold on to their borrowed shares. A higher CTB puts more pressure on short sellers and can force them to close their positions. Borrow Fees are compiled from several different sources, so this is a realistic number that is being charged across many brokerages.
Share Availability (Unique to SqueezeFinder) – The second most important criteria is share availability. If short sellers can’t find shares to borrow then they can’t open new short positions. And if the short sellers can’t add or open positions, then selling pressure is greatly reduced and buyers can take control of the price action. SqueezeFinder scores this criteria based on a 3 hour average number of shares available. As share availabilty dries up, this score will go up but when share availability increases, the score goes down accordingly. Again, we are pulling in share availability from multiple sources and averaging them together for accuracy. We are the only service using realtime share availability to calculate our scores.
Days to Cover (DTC) – This value represents the length of time it would take for every short to cover their positions. It’s an important factor but not as important as the criteria above. When shorts start to cover, the daily volume will simply explode and a squeeze can happen inside of 1 day even though the stock is showing 5 days to cover. The DTC is actually more important in determining where we are in the squeeze process. A very high DTC indicates the stock is not squeezing yet, but pressure is building up. SqueezeFinder gives a maximum score of 10/10 for DTC.
Market Capitalization – Market Cap is the absolute value of a company. A lower market cap is good for squeezes because it takes less buying pressure to move the price upwards.
Public Float Size – Public float has a very similar impact to the squeeze process as the market cap. A lower public float makes it easier to create buying pressure and force a squeeze.
% of Float Sold Short – It is critical to know the percentage of float which has already been shorted. This value can be considered as the amount of “juice” that can be squeezed out of the stock.
% of Float on Loan – This value represents the shares that have been borrowed but not yet sold short. This is often overlooked, but it is important because it lets us know how much ammunition is still available for shorts to sell the price down.
% Float Short vs On Loan (Unique to SqueezeFinder) This calculation determines the additional selling power available to short sellers. It can also be an indicator that some naked shorting is happening in a stock.
FTDs vs Float (Unique to SqueezeFinder) This calculation measures upcoming FTD’s that will be due in the next 10 days. That measurement is compared against the float size to determine the % of float that will be due soon. Extremely high FTD’s can help a squeeze get moving, but we don’t want to subtract from the overall Squeezability score when the FTD count is low. That’s why the scale is 5 to 15 on this criteria.
Short Seller Gains or Losses vs Mkt Cap (Unique to SqueezeFinder) – This calculation is critical for determining the probability of a squeeze. When short sellers are in a losing trade they are more inclined to close their position before the losses get any worse. Their gains or losses must be compared to the market cap of the stock before any useful information can be determined.
Has there been a recent squeeze? (Unique to SqueezeFinder) – The final criteria determines whether or not a stock has recently squeezed. This is very important because multiple squeezes within a short timeframe are exceedingly rare. What usually happens during the squeeze is that shorts will roll over each other. Old shorts are taking losses and buying-to-cover, while new shorts are coming into the stock and selling-to-open at or near the highs. It is common for the other criteria to remain elevated after a squeeze has occurred, but it is rare that another squeeze will happen any time soon.
Juice Target (Unique to SqueezeFinder) – This is a potential price target that estimates how far a stock might run during a squeeze. The scores from Market Cap, % of Float Sold Short and % of Float On Loan are used to create an estimated price movement from recent lows. This target is rounded to the nearest whole dollar and should be treated as a ballpark estimate ONLY. It can be very helpful during a squeeze, and also to determine when the squeeze is close to being done.
Social Sentiment (Unique to SqueezeFinder) – This score tracks social media “buzz” and assigns a score from 1 to 20 based on current rank as well as 24 hour trends. A score ovevr 15 is considered very positive and represents strong current social sentiment as well as a recent uptrend in social sentiment. This score is critical when trying to time the squeeze.
Once all of this data has been compiled, the values are averaged into what we call a “Squeezability Score”. The score is on a scale from 1-10 where a value of 9+ represents a 90%+ chance of a short squeeze occurring.


